This article has been reviewed by Sumeet Sinha, MBA (Emory University Goizueta Business School). Should you have any inquiries, please do not hesitate to contact at sumeet@finlightened.com.
[updated with new ETF summaries, Oct 2022]
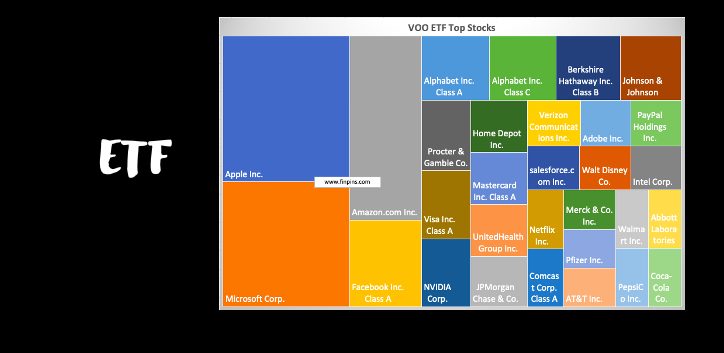
What is ETF? ETF or Exchange Traded Fund is a mini-portfolio of stocks (or bonds) that can be traded over a stock exchange like other securities such as stocks. For example, the Vanguard S&P 500 ETF (symbol VOO) is made of 514 securities and it aims to mimic the performance of the S&P 500 Index. VOO can be purchased and sold like any other stock such as Apple (AAPL) or Microsoft (MSFT).
Most of the popular Exchange Traded Funds can be traded on apps like Robinhood, M1 Finance, WeBull, etc. In this article, we will look at the index and thematic ETFs such as ETF for NASDAQ, Dow Jones, Genomics, High Dividend, AI, etc.
We will compare the performance, PE ratios, and Dividend yields of the popular Vanguard ETFs for growth, value, and dividend investors. Below, we will also discuss leveraged ETFs (that amplify the returns) and whether are they good for holding long term.
ETFs can be created with multiple objectives. Many of them are created to passively track the performance of an index such as the S&P 500. Many others do not track any specific index, but rather focus on a particular sector or niche, for example, ARKQ focuses on Artificial Intelligence, SDY focuses on high dividend stocks, etc.
Why use ETF?
As a mini-portfolio, an ETF reduces investor risk by diversifying into multiple assets.
ETFs facilitate an investor to invest in a particular sector without picking multiple company stocks individually. For example, for betting on technology, an investor can invest in QQQ instead of buying multiple tech stocks.
An average investor might find investing in a set of ETFs a lot easier than managing multiple sub-portfolios themselves (1 ETF each for AI, Cloud, and healthcare instead of 10 stocks for AI, 20 stocks for cloud computing, 15 stocks for healthcare, etc.)
Investors must make informed decisions before allocating their money to any financial instrument. Please read the articles below to understand the features, similarities, and differences.
Basic Terminology of ETFs
Expense Ratio
Expense Ratio: Think of it as fees paid for investing in a fund. For example, a 0.04% expense ratio on IVV means you’d pay $0.40 (40 cents) per $1000 invested in IVV every year.
AUM or Assets Under Management
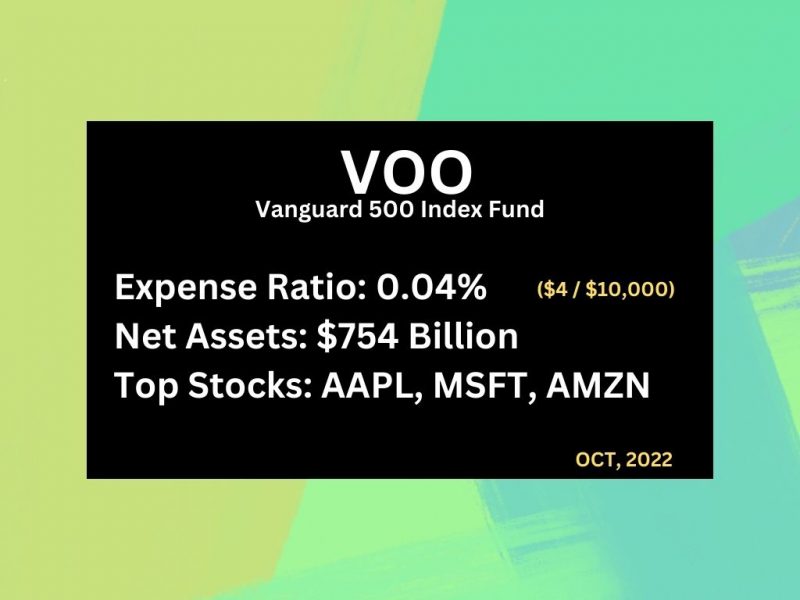
AUM or Assets Under Management is the total market value of the assets held by the Fund. For example, for SPY the AUM is $326 B and for VOO the AUM is $754 B even though they both track the same index (S&P 500) because SPY manages more ‘quantity’ of underlying assets than VOO.
ETFs for S&P 500 Index
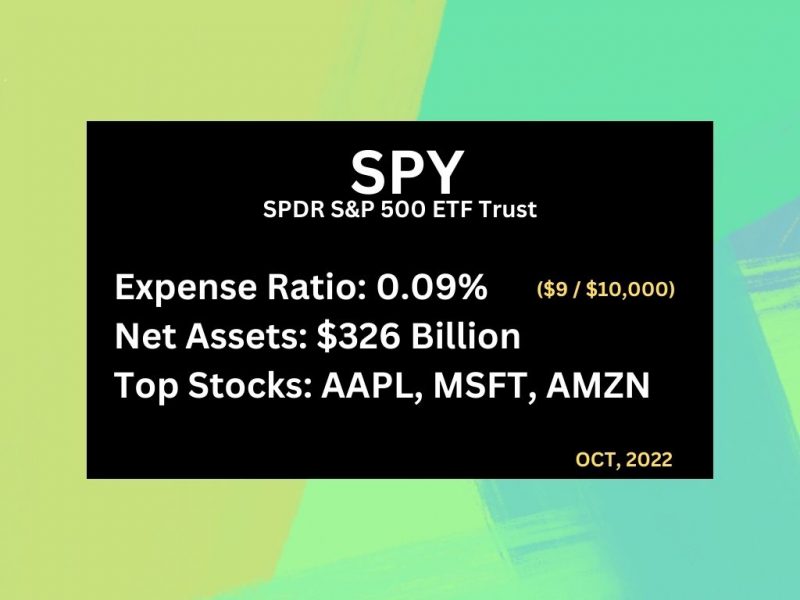
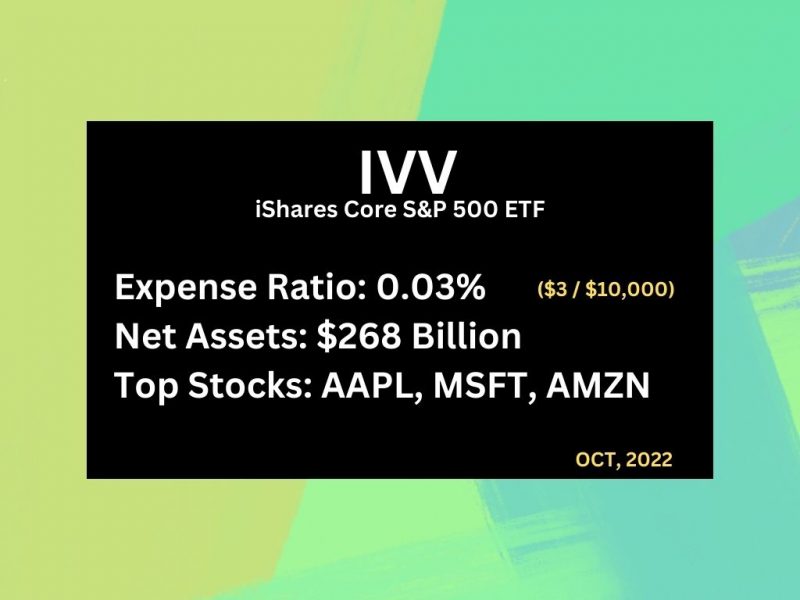
The three popular ETFs for tracking the S&P500 Index are the following:
- IVV: iShares Core S&P 500
- expense ratio 0.03%
- SPY: SPDR S&P 500 ETF Trust
- expense ratio 0.09%
- VOO: Vanguard 500 Index Fund
- expense ratio 0.04%
ETF for DOW Jones Industrial Average Index
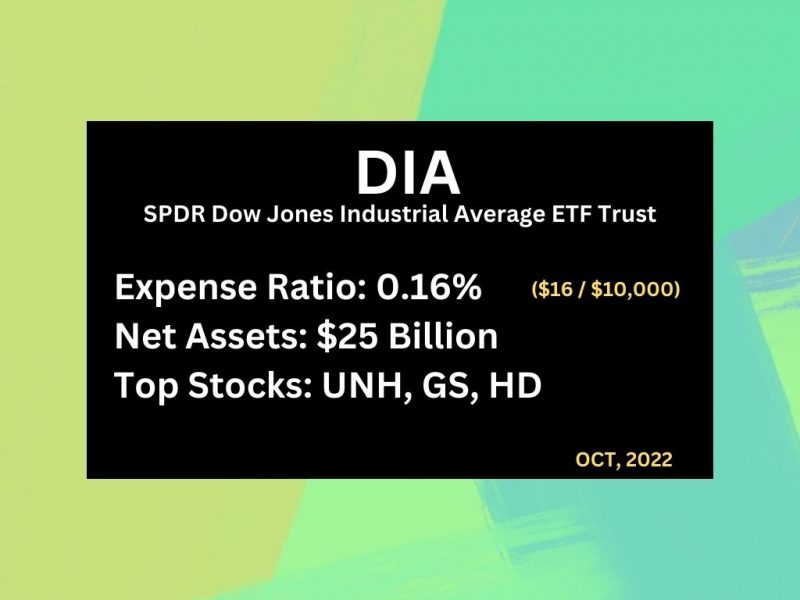
A popular ETF for tracking the Dow Jones Industrial Average Index is the following:
- DIA: SPDR Dow Jones Industrial Average ETF Trust
- expense ratio 0.16%
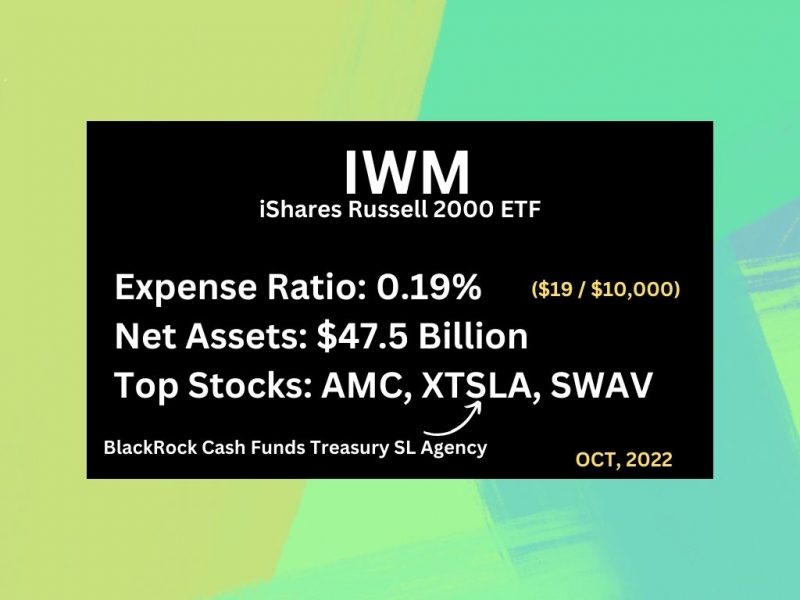
ETFs for Russell 2000 Index
A popular ETF for tracking the Russell 2000 Index is the following:
- IWM: iShares Russell 2000
- expense ratio 0.19%
ETF for NASDAQ Index
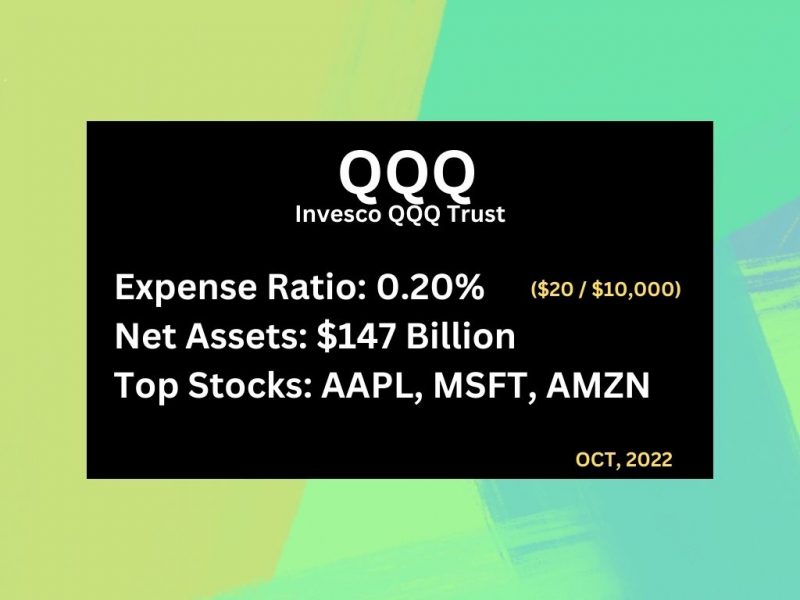
A popular ETF for tracking the NASDAQ index is the following:
Bestseller Personal Finance Books
- QQQ: Invesco QQQ Trust Series 1
- expense ratio 0.20%
ETFs for High Dividends and Dividend Growth
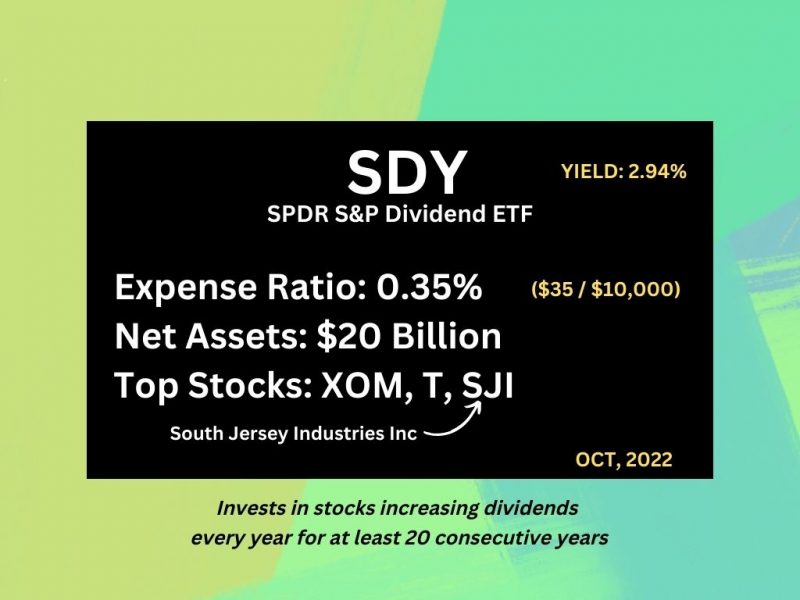
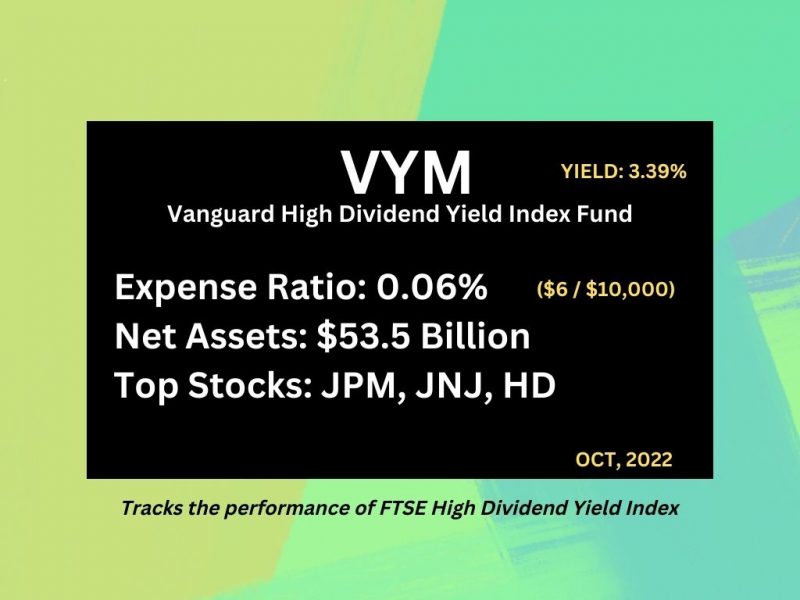
Three popular ETFs for investing in dividend stocks are the following:
- SDY: SPDR S&P Dividend (ETF for Dividend Growth)
- expense ratio 0.35%
- VYM: Vanguard High Dividend Yield (ETF for High Dividend Yield)
- expense ratio 0.06%
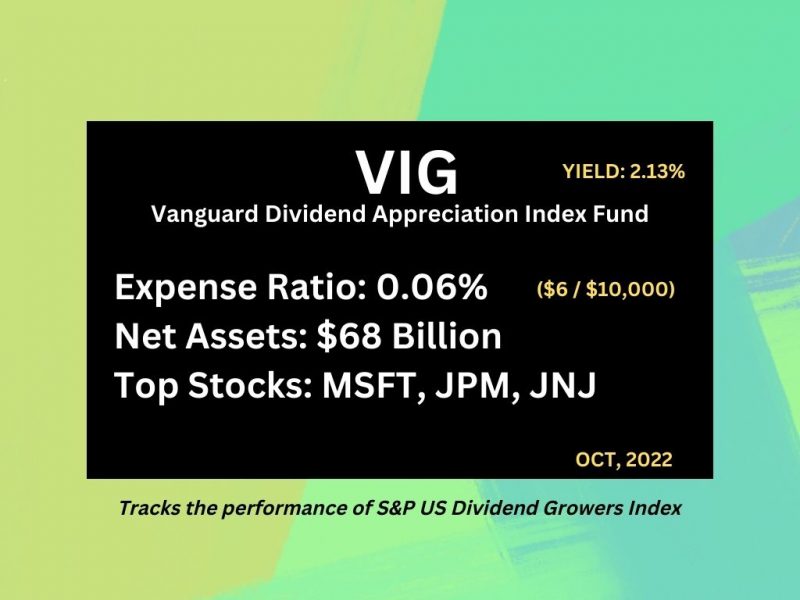
- VIG: Vanguard Dividend Appreciation Index Fund (ETF for Dividend Growth)
- expense ratio: 0.06%
ETF for Genomics
A popular ETF for investing in genomics is the following:
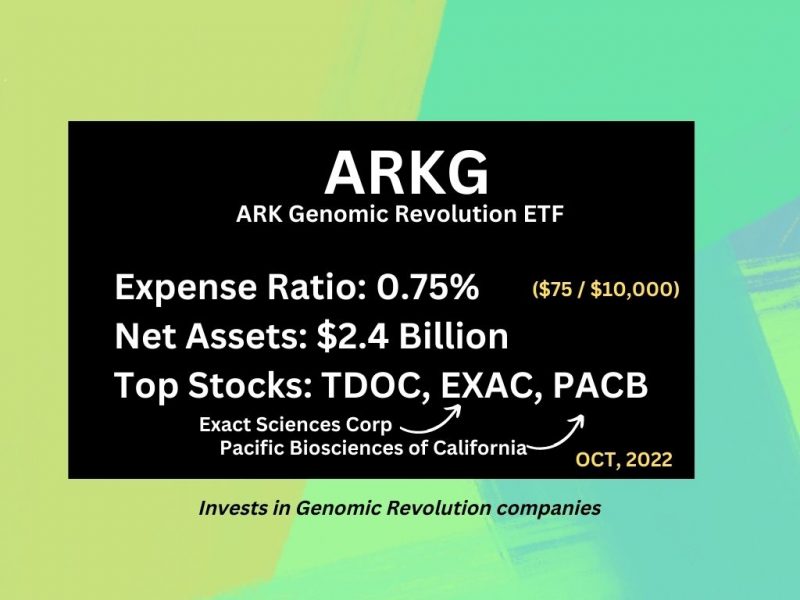
- ARKG: ARK Genomic Revolution
- expense ratio 0.75%
ETF for Financial Technology (FinTech)
A popular ETF for investing in fintech is the following:
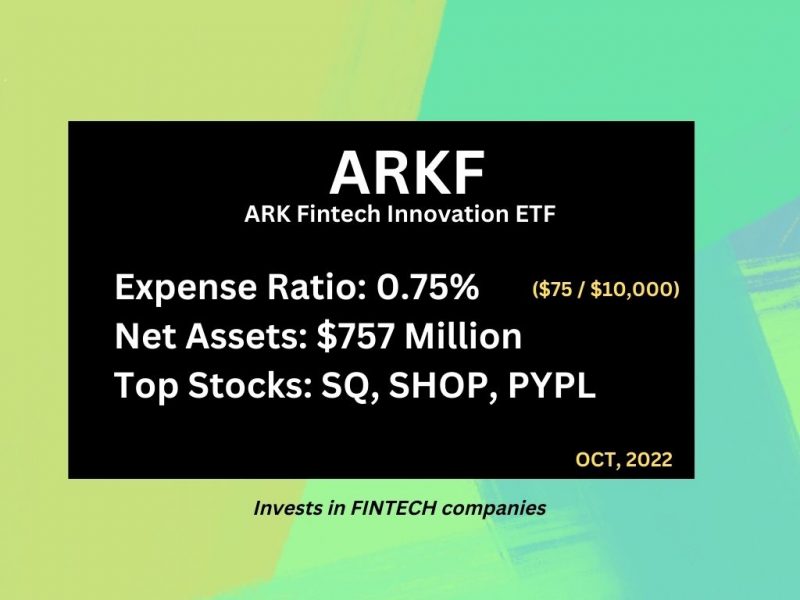
- ARKF: ARK Fintech Innovation ETF
- expense ratio 0.75%
ETFs for Blockchain
Two popular ETFs for investing in blockchain stocks are the following:
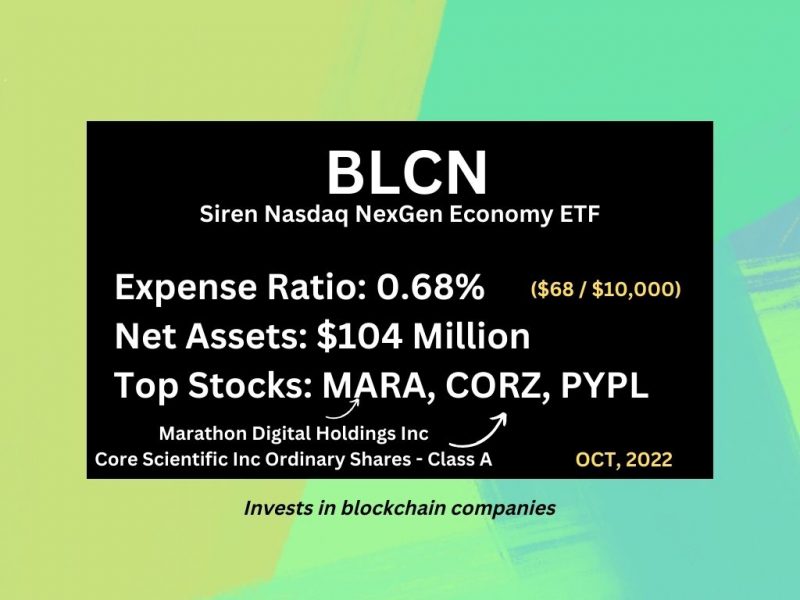
- BLCN: Reality Shares Nasdaq NexGen Economy
- expense ratio 0.68%
- BLOK: Amplify Transformational Data Sharing
- expense ratio 0.71%

ETFs for AI (Artificial Intelligence), Robotics, Autonomous Technology
Two popular ETFs for investing in AI stocks are the following:
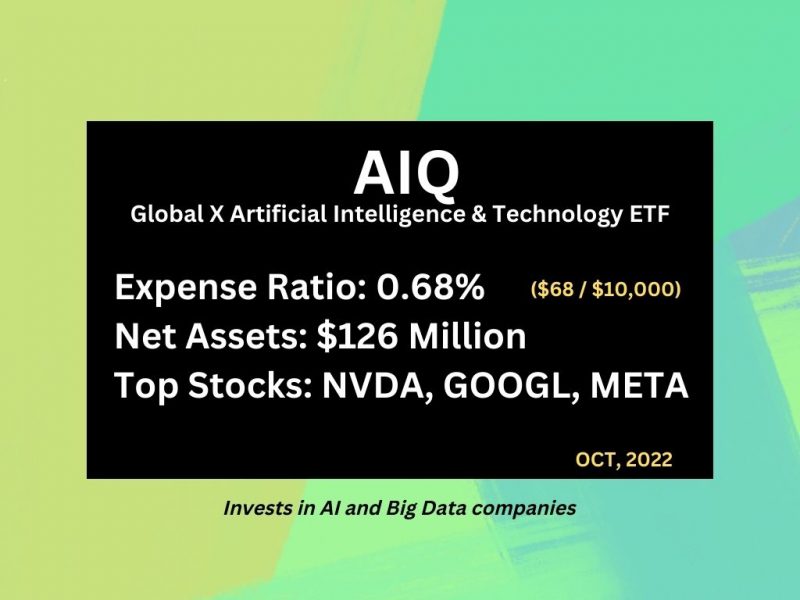
- AIQ: Global X Artificial Intelligence & Technology
- expense ratio 0.68%
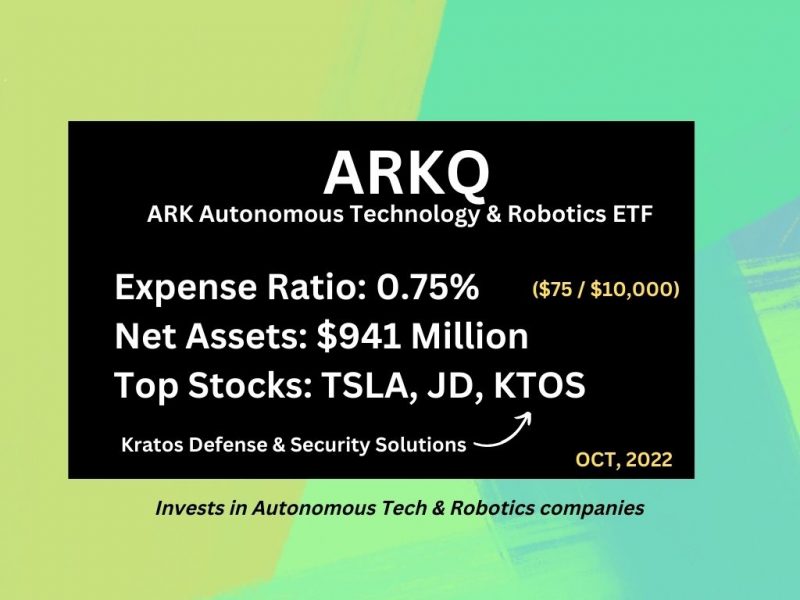
- ARKQ: ARK Autonomous Technology & Robotics
- expense ratio 0.75%
Vanguard ETFs: VOOV vs VUG vs VYM
[Section updated: 15 Dec 2020]
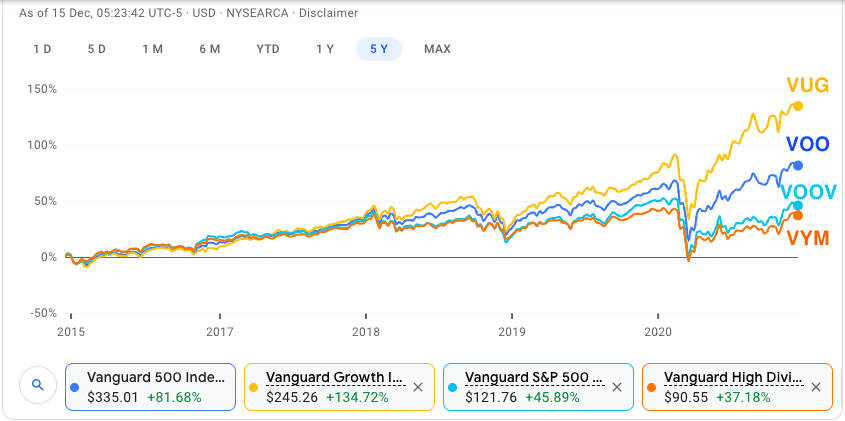
VOO | Vanguard S&P 500 ETF
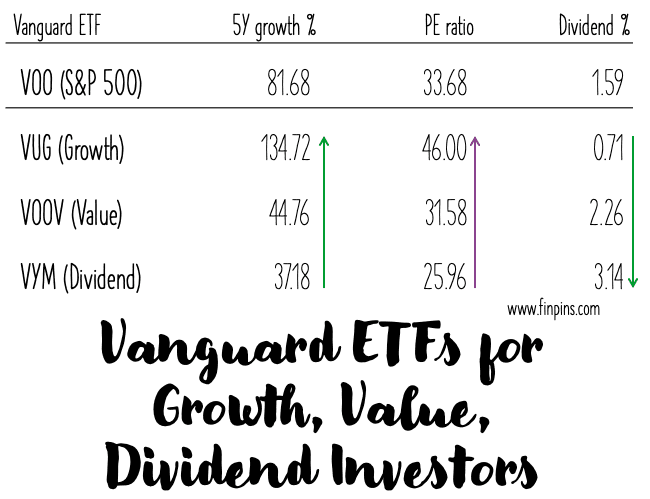
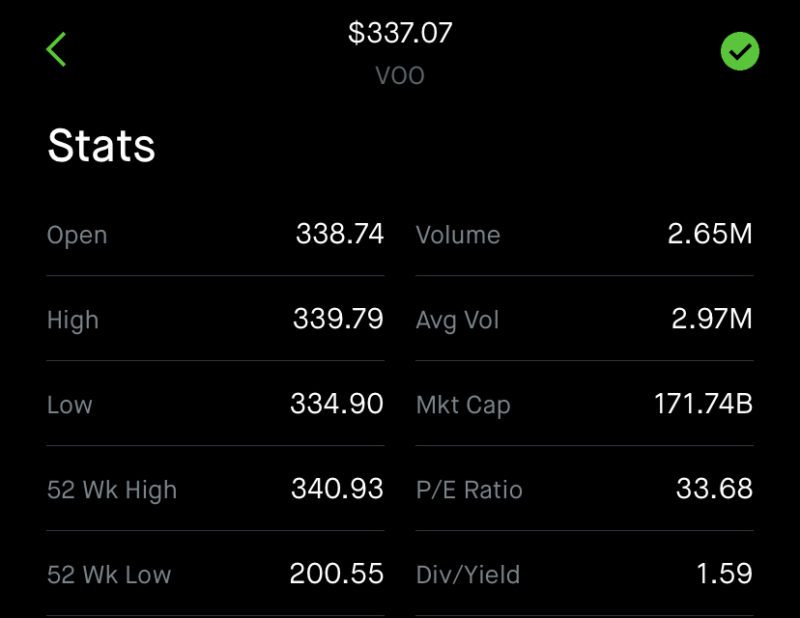
Vanguard S&P 500 ETF (VOO) is the tracker for S&P 500 Index. VOO tracks a market-cap-weighted index of US large-cap and mid-cap stocks in the S&P 500.
- Growth in the last 5 years: 81.68%
- Price-Earning Ratio: 33.68
- Dividend Yield: 1.59%
VUG | Vanguard Growth ETF
Vanguard Growth ETF (VUG) tracks the CRSP US Large-Cap Growth Index, which selects large-cap and mid-cap stocks with growth characteristics, such as potential growth in earnings per share (EPS). Generally, growth ETFs have a high PE ratio and low dividend yields.
- Growth in the last 5 years: 134.72%
- Price-Earning Ratio: 46.00
- Dividend Yield: 0.71%
VOOV | Vanguard S&P 500 Value ETF
Vanguard S&P 500 Value ETF (VOOV) is the ETF for value investors. VOOV tracks an index of primarily large-cap US stocks, selecting value stocks from the S&P 500. Generally, Value ETFs have a moderate PE ratio and moderate dividend yields.
- Growth in the last 5 years: 44.76%
- Price-Earning Ratio: 31.58
- Dividend Yield: 2.26%
VYM | Vanguard High Dividend Yield ETF
Vanguard High Dividend Yield ETF (VYM) is the ETF for dividend seekers. VYM tracks the FTSE High Dividend Yield Index. The index selects high-dividend-paying US companies, excluding REITs, and weights them by market cap. Generally, high dividend ETFs have a low PE ratio and high dividend yields.
- Growth in the last 5 years: 37.18%
- Price-Earning Ratio: 25.96
- Dividend Yield: 3.14%
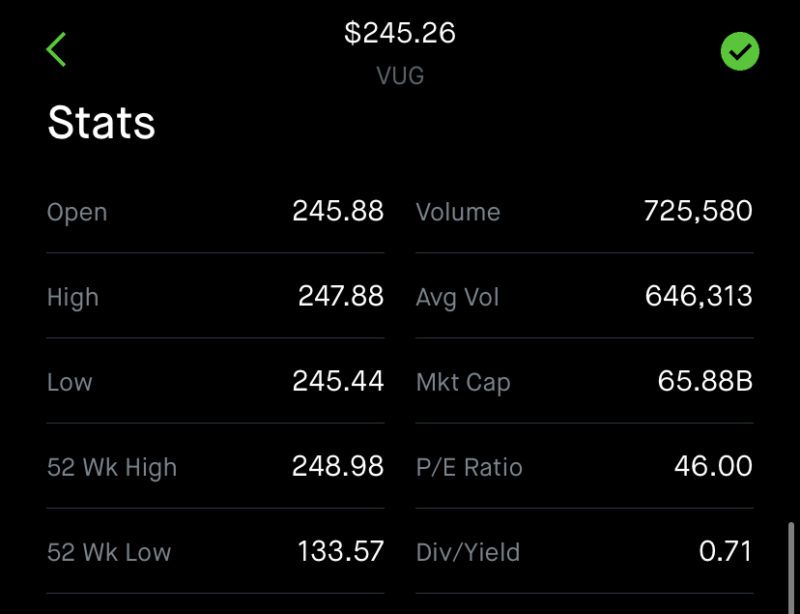
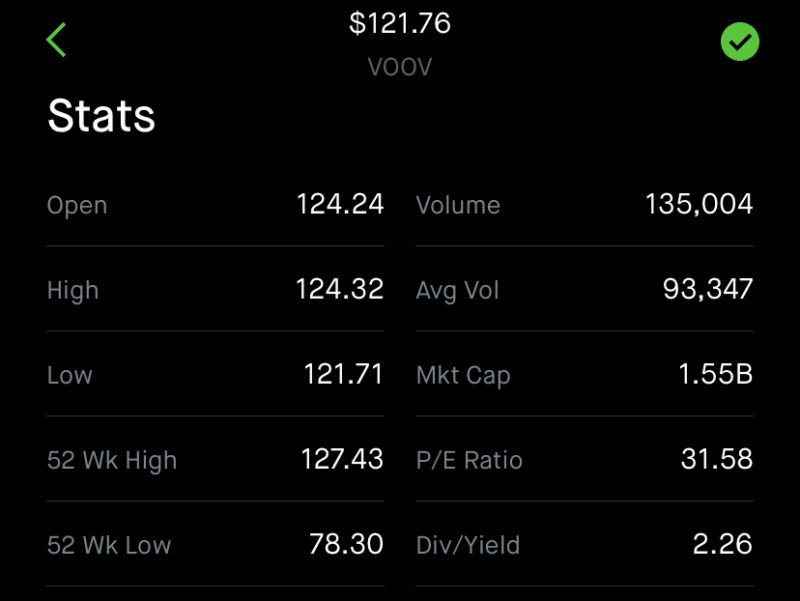
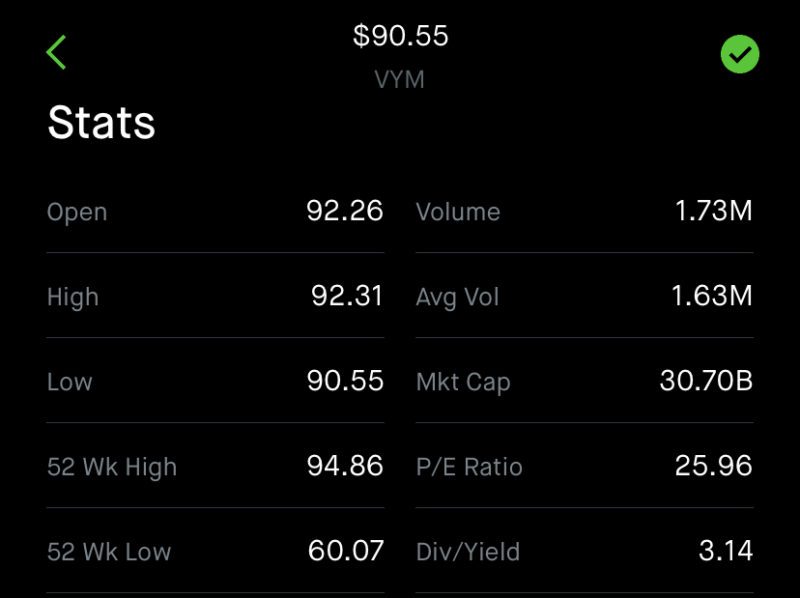
5-year Price Appreciation: VOO, VUG, VOOV, VYM
What are leveraged ETFs? What are TQQQ and SQQQ ETFs?
Leveraged exchange-traded funds (ETFs) aim to amplify the returns of an index or target fund.
A regular ETF such as Invesco QQQ Trust Series 1 ETF (QQQ) aims to track the return of the Nasdaq 100 Index, i.e. if Nasdaq Index goes up by 5%, QQQ goes up by 5%, and if Nasdaq goes down by 3% QQQ goes down by 3%.
A leveraged ETF aims for a multiplier of the return, for example, Proshares Ultra Pro TQQQ (TQQQ) is 3X ‘long’ on QQQ. What that means is if QQQ goes up by 5%, TQQQ goes up by 15%, when QQQ goes down by 3%, TQQQ goes down by 9%!
Similarly, there are leveraged ‘short’ ETFs as well. ProShares UltraPro Short QQQ ETF (SQQQ) is 3X ‘short’ on QQQ. So when QQQ goes up by 5%, SQQQ goes down by 15%, when QQQ goes down by 3%, SQQQ goes up by 9%.
List of Leveraged ETFs
Like TQQQ and SQQQ, there are many more 2x, 3x long, and short ETFs. A few of the popular ones are listed below.
Long 2X on S&P 500
- ProShares Ultra S&P 500 (SSO)
- Direxion Daily S&P 500 Bull 2x Shares (SPUU)
‘Bull’ ETF is a ‘Long’ ETF, so if S&P 500 goes up by 5%, SPUU and SSO go up by 10% (SPUU and SSO are 2x Long ETFs)
Long 3X on S&P 500
- ProShares UltraPro S&P 500 (UPRO)
if S&P 500 goes up by 5%, UPRO goes up by 15% (UPRO is a 3x Long ETF)
Short 3X on S&P 500
- ProShares UltraPro Short S&P 500 (SPXU)
- Direxion Daily S&P 500 Bear 3X Shares (SPXS)
‘Bear’ ETF is a ‘short’ ETF, so if S&P 500 goes up by 5%, SPXS and SPXU would go down by 15%!
Can you hold leveraged ETFs for the long term?
The answer is NO! Leveraged ETFs can be very risky because of the amplified volatility. Leveraged ETFs can be great for short-term speculation and bring you great returns, but for a longer-term horizon leveraged ETFs are not suitable.
See below the hypothetical returns on QQQ, TQQQ, and SQQQ over a 20+ year investment horizon.
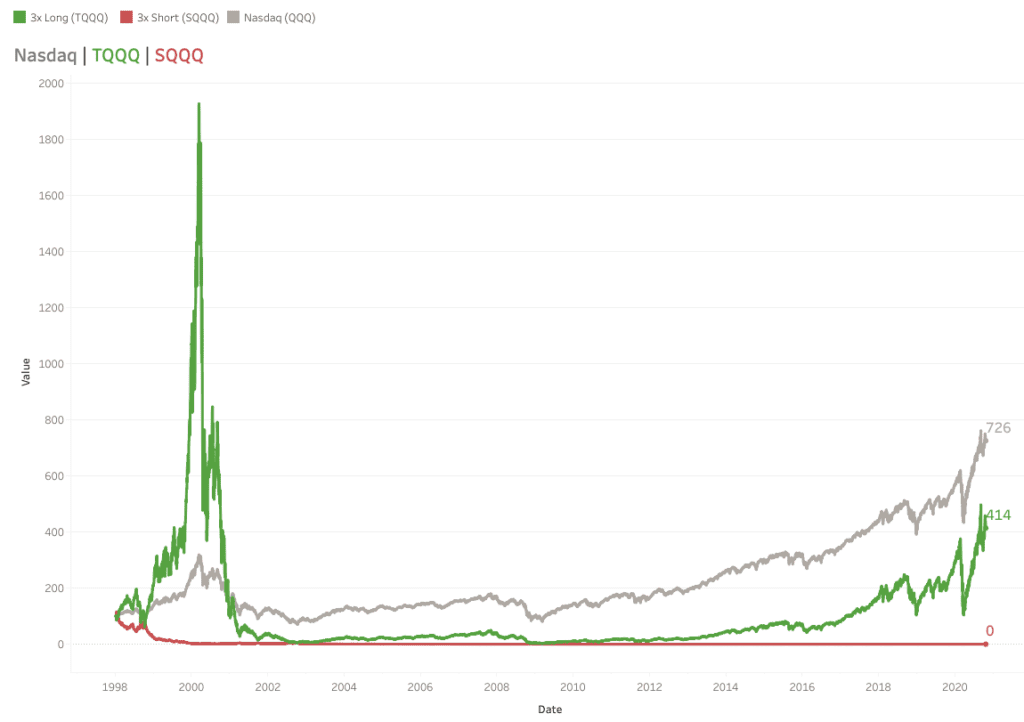
All three start at $100 in January 1998. During the dot com boom, while QQQ reaches a max of 314, TQQQ hit an insane high of $1929 in March 2000 (i.e. $100 invested would have become $1929). If you are able to speculate and sell it, you can make good profits. However, look at the downside too. If you don’t sell and hold it longer, when QQQ declines to $104, TQQQ declines at an accelerated rate and falls to $27 in April 2001. That’s a huge swing in fortune!
If you keep holding TQQQ through October 2020, QQQ reaches $726, while TQQQ only manages to climb back up to $414. So, QQQ wins in this long-term scenario of bull and bear markets included.
SQQQ has a dismal story. In a bull market, it declines very rapidly and reaches such a low point from where it is impossible to recover to its previous price levels. As you can observe, one sharp rise in the stock market drives down SQQQ to near-zero levels and it stays there for a long long time.
Please be careful when investing in leveraged ETFs and understand the pros and cons before committing your money to them. Leveraged ETFs can be good for short-term speculation, but buying and holding for the long term is not the best strategy for leveraged ETFs.
Is there an ETF for Covered Calls?
If you know about stock options, you must have heard about the income generation strategy through selling covered calls. Probably, you would have also thought – ‘Wouldn’t it be great if someone else would do the hard work of researching and selling covered calls to generate some income?’.
You’re in luck! XYLD does exactly that.
XYLD is the symbol for S&P 500 Covered Call ETF
XYLD has an expense ratio of 0.60% and approximately $600 M in Assets Under Management as of October 2021. Writing Covered Calls can generate high income during the high volatility in the market. XYLD sells covered calls on the S&P500 index.
The Global X S&P 500 Covered Call ETF (XYLD) follows a “covered call” or “buy-write” strategy, in which the Fund buys the stocks in the S&P 500 Index and “writes” or “sells” corresponding call options on the same index.
The Global X S&P 500 Covered Call ETF (XYLD) seeks to provide investment results that correspond generally to the price and yield performance, before fees and expenses, of the Cboe S&P 500 BuyWrite Index.
Source: GobalXETFs

Read more
Popular Topics: Stocks, ETFs, Mutual Funds, Bitcoins, Alternative Investing, Dividends, Stock Options, Credit Cards
Posts by Category: Cash Flow | Credit Cards | Debt Management | General | Invest | Mini Blogs | Insurance & Risk Mgmt | Stock Market Today | Stock Options Trading | Technology
Useful Tools
Student Loan Payoff Calculator | Mortgage Payoff Calculator | CAGR Calculator | Reverse CAGR Calculator | NPV Calculator | IRR Calculator | SIP Calculator | Future Value of Annuity Calculator
Home | Blog
Our Financial Calculator Apps
Page Contents

