This article has been reviewed by Sumeet Sinha, MBA (Emory University Goizueta Business School). Should you have any inquiries, please do not hesitate to contact at sumeet@finlightened.com.
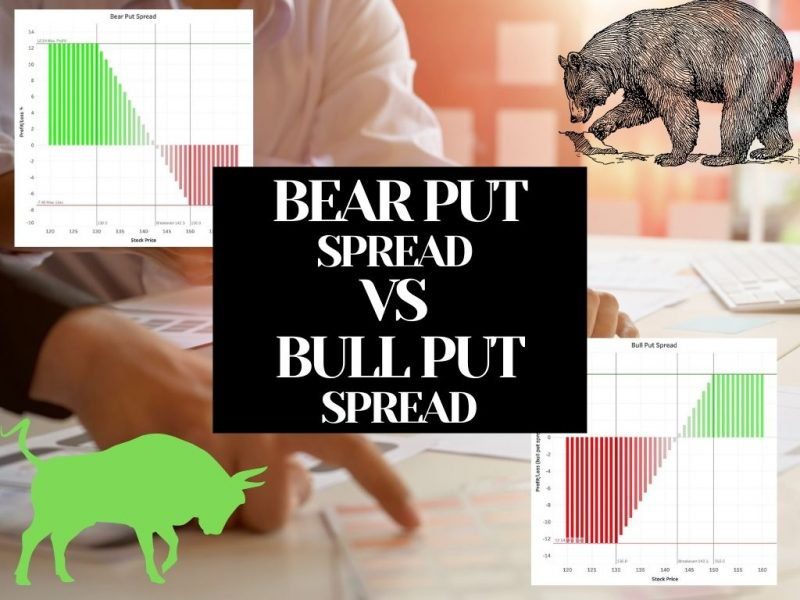
With the combination of two put options with the same expiration date, we can create Put Spreads. We can do so in both directions, whether we feel bullish or bearish. Let’s take a look at the details and compare Bear Put Spread vs Bull Put Spread.
Bear Put Spread
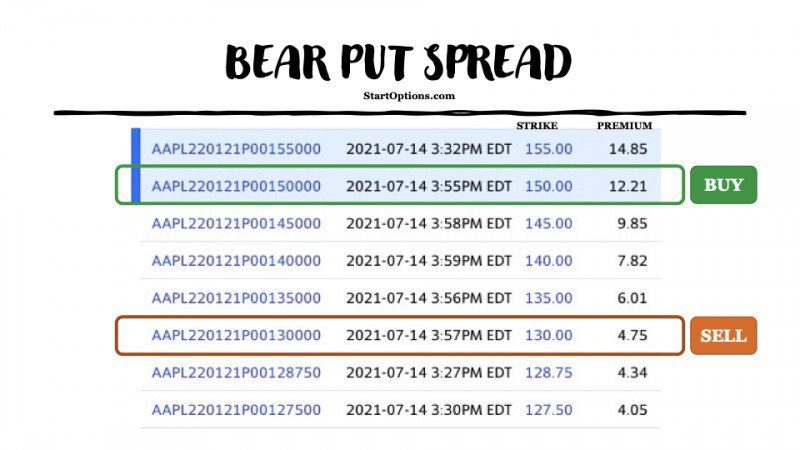
A bear put spread is a vertical options spread created by buying a put option (long put) at a higher strike price, and selling a put option (short put) at a lower strike price. Both the put options – long and short – must have the same expiration date. In the example below, we are buying a $150 Strike Price put and selling a $130 Strike Price put. Both have the same expiration date of January 21, 2022, and the strike spread is $20 (i.e. $150 – $130).
Is Bear Put Spread a Net Debit or Net Credit spread?
A Bear Put Spread is a Net Debit spread.
Since we sell a lower strike put (which is cheaper) and buy a higher strike put (which is more expensive), on a net basis pay money to create a bear put spread. In the example shown above, we can sell the $130 strike put and collect $4.75 per share (or $475 for the contract of 100 shares), and we pay $12.21 per share (or $1,221 for the contract of 100 shares) for buying the $150 strike put.
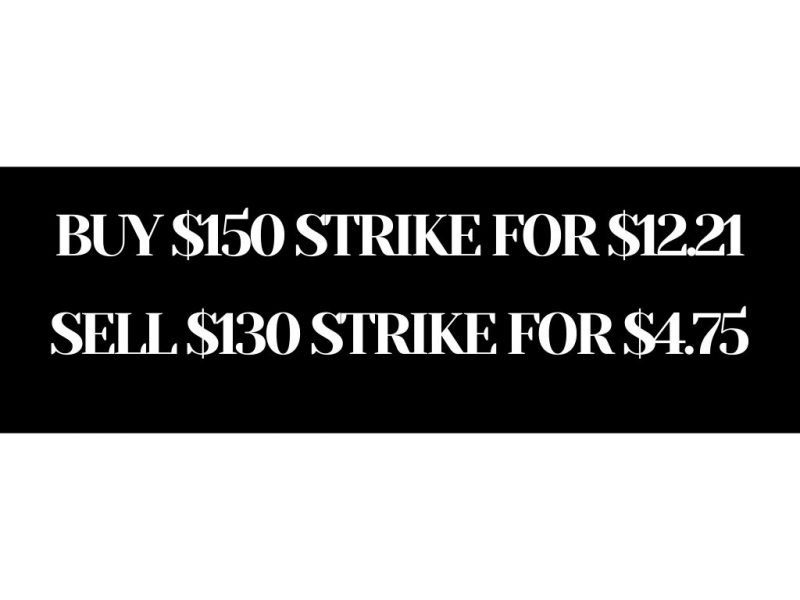
On a net basis, we’ll pay $12.21 – $4.75 = $7.46 to create this bear put spread, hence it is a net debit spread.
Net debit = $7.46 per share or $746 for the spread.
What is the Maximum Profit in a Bear Put Spread?
The maximum profit in a bear put spread = Strike Spread – |Net Debit|
In this case, maximum profit = $20 – 7.46 = $12.54 per share, or $1,254 for the spread.
What is the Maximum Loss in a Bear Put Spread?
The maximum loss in a bear put spread = Net Debit
In this case, maximum loss = $7.46 per share, or $746 for the spread.
What is the Breakeven Point of a Bear Put Spread?
The breakeven point of a bear put spread = Higher Strike Price (i.e. of Long Put) – |Net Debit|
In this case, breakeven point = $150 – $7.46 = $142.54.
Bear Put Spread – Profit and Loss Graph
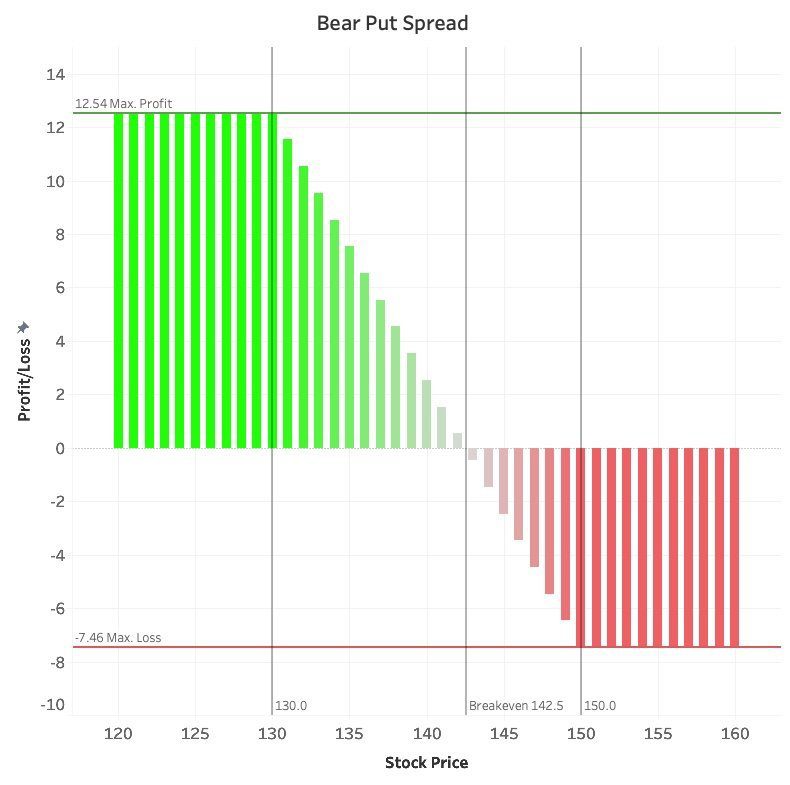
Both the maximum profit and maximum loss are observed between the higher and lower strike prices of the bear put spread. The maximum profit is capped at the point when the stock price is at the lower strike price. The maximum loss is contained at the point when the stock price rises to the higher strike price. There is one breakeven point and (mostly) it lies in between the two strike prices.
Bull Put Spread
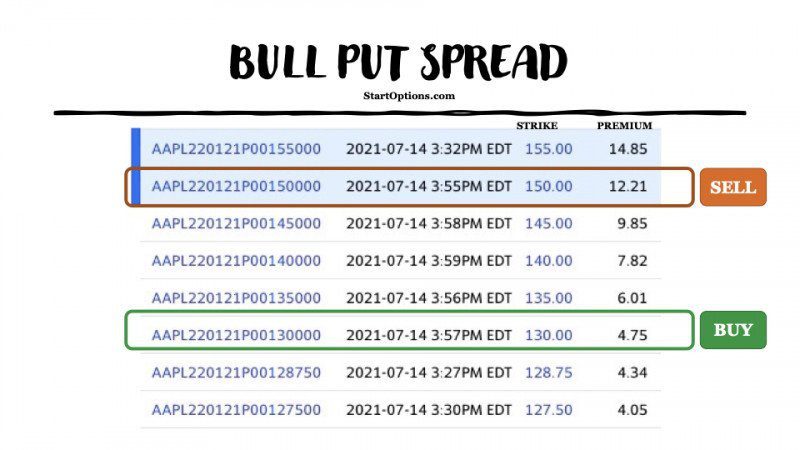
A bull put spread is a vertical spread created by buying a put option (long put) at a lower strike price, and selling a put option (short put) at a higher strike price. Both the put options – long and short – must have the same expiration date. In the example below, we are buying a $130 Strike Price put and selling a $150 Strike Price put. Both have the same expiration date of January 21, 2022, and the strike spread is $20 (i.e. $150 – $130).
Bestseller Personal Finance Books
Is Bull Put Spread a Net Debit or Net Credit spread?
A Bull Put Spread is a Net Credit spread.
Since we buy a lower strike put (which is cheaper) and sell a higher strike put (which is more expensive), on a net basis we collect money to create a bull put spread. In the example shown above, we can buy the $130 strike put for $4.75 per share (or $475 for the contract of 100 shares), and we can collect $12.21 per share (or $1,221 for the contract of 100 shares) for selling the $150 strike put.
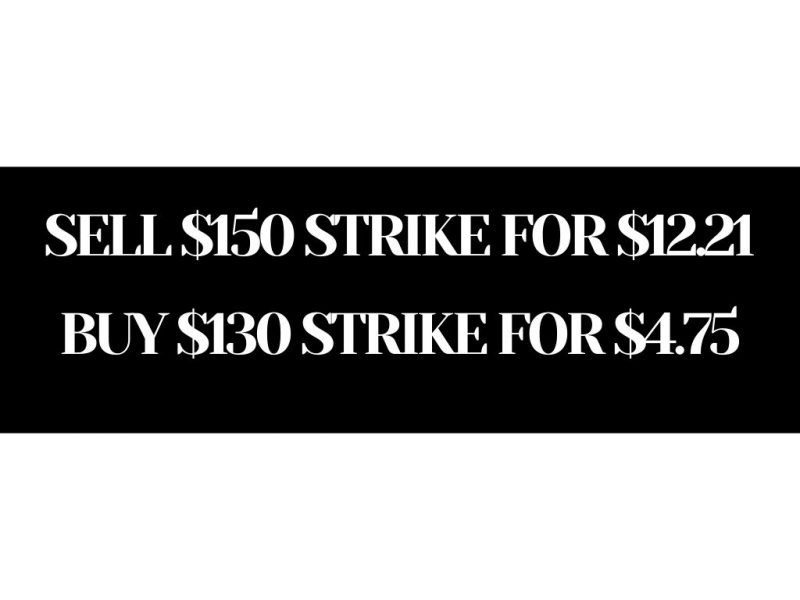
On a net basis, we’ll collect $12.21 – $4.75 = $7.46 to create this bull put spread, hence it is a net credit spread.
Net credit = $7.46 per share or $746 for the spread.
What is the Maximum Profit in a Bull Put Spread?
The maximum profit in a bull put spread = Net Credit
In this case, maximum profit = $7.46 per share, or $746 for the spread.
What is the Maximum Loss in a Bull Put Spread?
The maximum loss in a bull put spread = Strike Spread – Net Credit
In this case, maximum loss = $20 – $7.46 = $12.54 per share, or $1,254 for the spread.
What is the Breakeven Point of a Bull Put Spread?
The breakeven point of a bull put spread = Higher Strike Price (i.e. of Short Put) – |Net Credit|
In this case, breakeven point = $150 – $7.46 = $142.54.
Bull Put Spread – Zones of Profit and Loss
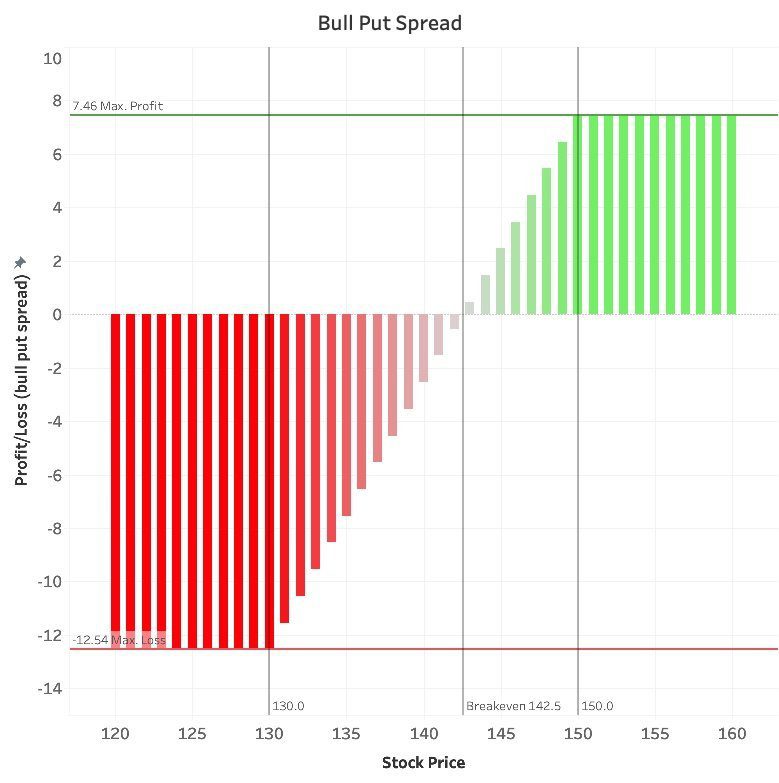
Both the maximum profit and maximum loss are observed between the higher and lower strike prices of the bull put spread. The maximum profit is capped at the point when the stock price reaches the higher strike price. The maximum loss is contained at the point when the stock price falls to the lower strike price. There is one breakeven point and (mostly) it lies in between the two strike prices.
Bear Put Spread vs Bull Put Spread: Comparison
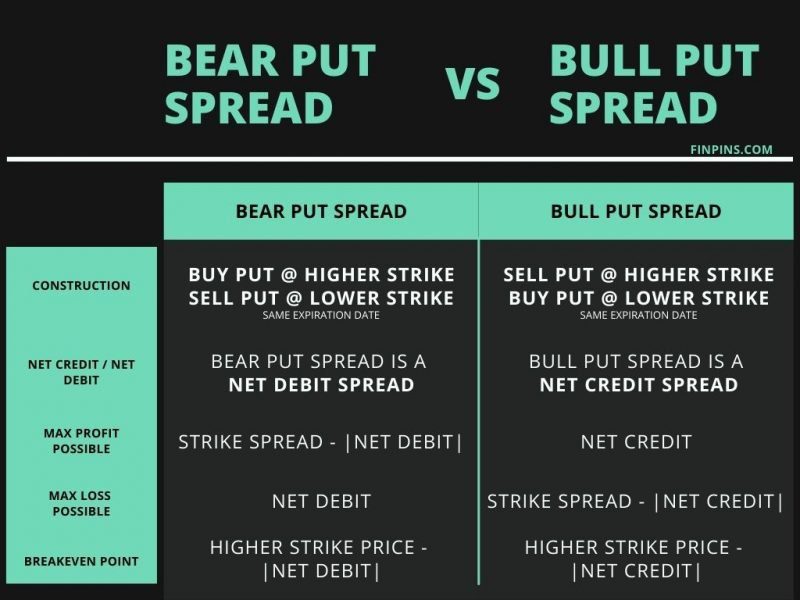
We will compare the bear put spread vs bull put spread on the 5 criteria:
- the construction of the spread, i.e. how you can create the spread
- net debit or net credit, i.e. whether we have to pay to buy the option contract
- max profit possible in the trade
- max loss possible in the trade
- breakeven point
For more on Stock Options, check out StartOptions.com
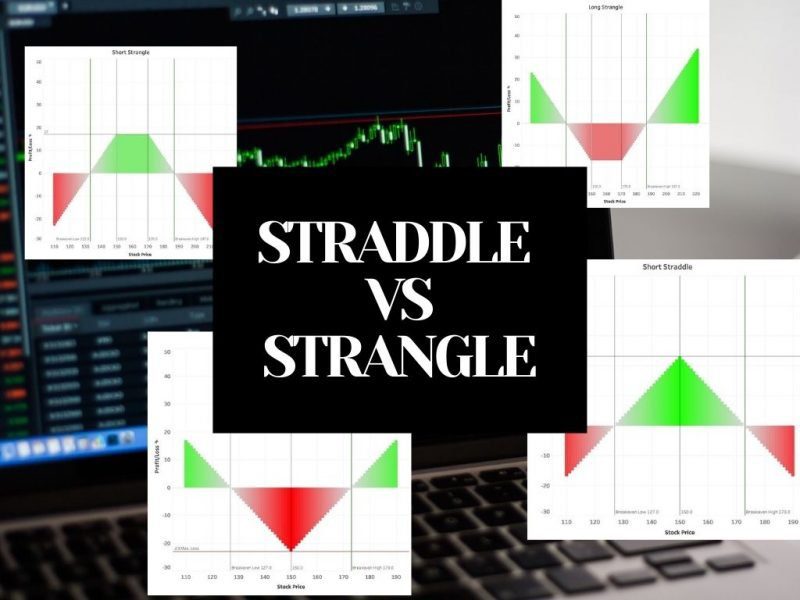
Read also: Straddle vs Strangle Options, Call vs Put Options

Read more
Popular Topics: Stocks, ETFs, Mutual Funds, Bitcoins, Alternative Investing, Dividends, Stock Options, Credit Cards
Posts by Category: Cash Flow | Credit Cards | Debt Management | General | Invest | Mini Blogs | Insurance & Risk Mgmt | Stock Market Today | Stock Options Trading | Technology
Useful Tools
Student Loan Payoff Calculator | Mortgage Payoff Calculator | CAGR Calculator | Reverse CAGR Calculator | NPV Calculator | IRR Calculator | SIP Calculator | Future Value of Annuity Calculator
Home | Blog
Our Financial Calculator Apps
Page Contents
